EDUCATION CENTRE
HOW TO READ THE CHARTS
To be profitable in today's world of technology and advancement, one must be proficient in reading and, more importantly, understanding chart patterns and basic technical indicators. Below are just a few basic points to help your understanding of technical analysis and currency chart reading.
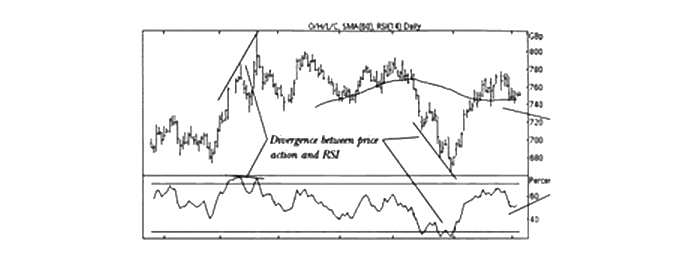
RELATIVE STRENGTH INDEX (RSI):
This index is a popular indicator of the Forex (FX) market. The RSI measures the ratio of up moves to down moves and normalises the calculation so that the index is expressed with a range of 0-100. If the RSI is 70 or greater, then the instrument is seen as overbought (a situation whereby prices have risen more than market expectations). An RSI of 30 or less is taken as a signal that the instrument may be oversold (a situation whereby prices have fallen more than market expectations).

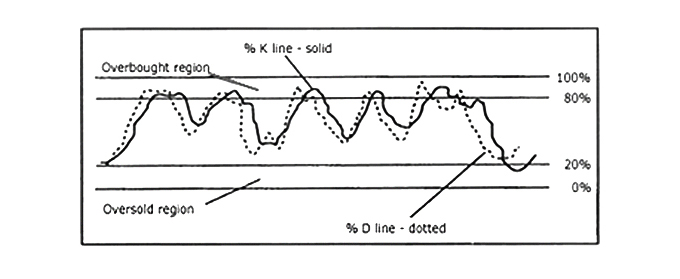
STOCHASTIC OSCILLATOR:
This is used to indicate overbought/oversold conditions on a scale of 0-100%. The indicator is based on the observation that in a b up trend, closing prices for periods tend to concentrate in the higher part of the period’s range. Conversely, as prices fall in a b down trend, closing prices tend to be near to the extreme low of the period range.
Stochastic calculations produce two lines, %K and %D, which are used to indicate overbought/oversold areas of a chart. Divergence between the stochastic lines and the price action of the underlying instrument gives a powerful trading signal.

PRICING
Price reflects the perceptions and action taken by the market participants. It is the urgency between buyers and sellers in the trading pit that creates price movement. Thus, all fundamental factors are quickly discounted in price. Therefore, by studying the price charts, you are indirectly seeing fundamental and market psychology simultaneously - after all the market is fed by two emotions - greed and fear - and once you understand that, then you begin to understand the psychology of the market and how it relates to the chart patterns.
DATA WINDOW
Most computer programs will display a small box of data, usually called a display window, which will contain the following items:
O = Opening Price
H = Highest Price
L = Lowest Price
C = Closing or Last Price
Tr = Volume or number of trades (not contracts) in that time period.
PRICE BARS
Price bars are a linear representation of a period of time. They enable the viewer to see a graphical representation summarising the activity within a specified time frame. For example, we use one-minute and five-minute bars in our system. Each bar has similar characteristics and gives the viewer several important pieces of information. Firstly, the highest point of the bar represents the highest price achieved during that time period. The lowest point of the bar represents the lowest price during the same period. Regular bars display a small dot on the left-hand side of the bar representing the opening price of the period. The small dot on the right-hand side represents the period's closing price.
MARKET TYPES
The market often displays some very familiar patterns of price movement. Once a pattern is established, it becomes the most probable course of future price action until the market changes. There are two types of market that become important for the beginner trader to identify: trending and trendless. Each market type has two specific patterns, which you will also come to recognise over time. These market types and patterns can be defined as follows:
- Trending - Steady elongated price movements with less than a 45-degree angle, with occasional pauses, profit taking or rest periods.
- Up-trends - A pattern of higher highs and higher lows.
- Down-trends - A pattern of lower lows and lower highs.
- Trendless - Erratic price movements that are often steep ( greater than a 45-degree angle) and cannot be sustained, so must reverse. Although this progress can move many points over a short period of time, it often results in very little net price movement over time.
- Choppy - An erratic pattern of higher highs and lower lows.
- Sideways - A narrow pattern of lower highs and higher lows.
While up-trend and down-trend days can offer excellent trading results, choppy markets often create stop-outs, while sideways markets produce little in either direction. Our trading objective is to get into a trending market and ride until we meet our target objective.
VOLUME
There are four easy rules to follow as far as volume is concerned:
- When prices are rising and volume is increasing, prices will continue to rise. The up-trend is being confirmed.
- When prices are rising but volume is decreasing, the up-trend is losing momentum and may be near the end.
- When prices are falling and volume is increasing, prices will continue to fall.
- When prices are falling and volume is decreasing, the down-trend is losing momentum and may be near the end.

